FORTIGATE
DIAGNOSE COMMANDS AND DEBUG
system info
get system interface physical
#overview of hardware interfaces
get hardware nic <nic-name>
#details of a single network interface, same as: diagnose hardware deviceinfo nic <nic-name>
fnsysctl ifconfig <nic-name>
#kind of hidden command to see more interface stats such as errors
get system status
#==show version
get system performance status
#CPU and network usage
diagnose sys top
#top with all forked processed
diagnose sys top-summary
#top easier, incl. CPU and mem bars. Forks are displayed by [x13] or whatever
execute dhcp lease-list
get system arp
diagnose ip arp list
diagnose ipv6 address list
diagnose ipv6 neighbor-cache list
diagnose sys ntp status
diagnose autoupdate versions
#lists the attack definition versions, last update, etc.
diagnose log test
#generated all possibe log entries
diagnose test application dnsproxy 6
#shows the IP addresses of FQDN objects
diagnose debug crashlog read
#shows crashlog, a status of 0 indicates a normal close of a process!

get hardware nic <interface_name>
get system arp
CPU
get system performance status
diagnose sys top
# → to sort by cpu shift + p
# → to sort by ram shift + m
execute top (lists high CPU or MEM usage)
execute iotop (list high I/O usage)
Firmware & Hardware
diagnose hardware test suite all

# disk partitions and layout
diagnose system print df
diagnose system print partitions
routing
diagnose firewall proute list
FGFM tunnel diagnose
diagnose debug application fgfmd 255
diagnose debug enable

diagnose fgfm session-list
diagnose dvm device list
Crash logs
diagnose debug crashlog read
diagnose debug crashlog history
diagnose debug crashlog read
commands to troubleshoot vpn tunnel
diagnose debug console
diagnose debug enable
diagnose debug application ike -1
diagnose debug application ssld -1
diagnose debug application sslvpn -1
diagnose vpn tunnel list
diagnose debug flow
ping from the xxx source address
execute ping-options source x.x.x.x
execute ping
reset the debugging
diagnose debug disable
diagnose debug reset
show full-configuration
To troubleshoot tunnel mode connections shutting down after a few seconds:
This might occur if there are multiple interfaces connected to the Internet, for example, SD-WAN. This can cause the session to become “dirty”.
To allow multiple interfaces to connect, use the following CLI commands.
If you are using a FortiOS 6.0.1 or later:
config system interface
  edit <name>
    set preserve-session-route enable
  next
end
If you are using a FortiOS 6.0.0 or earlier:
 config vpn ssl settings
   set route-source-interface enable
end
It is possible to identify a PSK mismatch using the following combination of CLI commands:
diagnose vpn ike log filter name <phase1-name>
diagnose debug app ike -1
diagnose debug enable
This will provide you with clues as to any PSK or other proposal issues.
If it is a PSK mismatch, you should see something similar to the following output:
ike 0:TRX:322: PSK auth failed: probable pre-shared key mismatch
ike Negotiate SA Error:
network
execute ping6-options ?
execute ping6-options source <source-interface-IP>
execute ping6 <hostname|ip>

execute ping-options ?
execute ping-options source <source-interface-IP>
execute ping <hostname|ip>

execute tracert6 <hostname|ip>

execute traceroute <hostname|ip>
execute traceroute-options ?
web-based manager
- Go to Network > Interface and select Create New > then Interfaces
- Enter the Name as Aggregate.
- For the Type, select 802.3ad Aggregate.
- If this option does not appear, your FortiGate unit does not support aggregate interfaces.
- In the Physical Interface Members click to add interfaces, select port 4, 5 and 6.
- Select the Addressing Mode of Manual.
- Enter the IP address for the port of eq. 10.13.101.100/24.
- For Administrative Access select HTTPS and SSH.
- Select OK.
To create aggregate interface - CLI
config system interface
edit Aggregate
set type aggregate
set member port4 port5 port6
set vdom root
set ip 172.20.120.100/24
set allowaccess https ssh
end
routing
get router info6 routing-table
#routing table = active routes
get router info routing-table all
#IPv4 needs an "all" at the end

get router info6 routing-table database
#Routing Information Base WITH inactive routes
get router info routing-table database

get router info6 kernel
#Forwarding Information Base
get router info kernel

diagnose firewall proute6 list
#Policy Routes + WAN Load Balancing
diagnose firewall proute list

get router <routing-protocol>
#basic information about the enabled routing protocol
diagnose ip rtcache list
#route cache = current sessions w/ routing information
sniffer
diagnose sniffer packet any 'host 192.168.19.134' 4 100 l
diagnose sniffer packet any 'host 8.8.8.8 and dst port 53' 4 10 a
diagnose sniffer packet wan1 'dst port (80 or 443)' 2 50 l
diagnose sniffer packet any 'net 2001:db8::/32' 6 1000 l
Flow
diagnose debug reset
diagnose debug flow filter saddr 10.200.200.1
diagnose debug flow filter daddr 192.168.50.90
diagnose debug flow show function-name enable
diagnose debug enable
diagnose debug flow trace start 100
diagnose debug disable
VPN
get vpn ike gateway <name>
get vpn ipsec tunnel name <name>
get vpn ipsec tunnel details
diagnose vpn tunnel list
diagnose vpn ipsec status
#shows all crypto devices with counters that are used by the VPN
get router info routing-table all

diagnose debug reset
diagnose vpn ike log-filter clear
diagnose vpn ike log-filter ?
diagnose vpn ike log-filter dst-addr4 1.2.3.4
diagnose debug app ike 255
#shows phase 1 and phase 2 output
diagnose debug enable
#after enough output, disable the debug:
diagnose debug disable
SSL VPN
diagnose debug enable
diagnose vpn ssl <...>
    - list → show current connections
    - info → general ssl-vpn info
    - statistics → show stats about memory, max and current connections
    - debug-filter → debug message filter for ssl-vpn
    - hw-acceleration-status → display the status of ssl hardware acceleration
    - tunnel-test → enable / disable ssl-vpn old tunnel mode IP allocation method
    - web-mode-test → enable / disable random session ID in proxy URL for testing

diagnose debug application sslvpn -1
diagnose debug enable
    - display debug messages for ssl-vpn -1 debug level produces detailed results
ssl user debug
diag debug application fnbamd 7
diag debug enable
diag test authserver ldap adserv01-test utest0000 W@is4it=gr8!
nested groups filter
set group-filter "(|(&(objectclass=group)(member:1.2.840.113556.1.4.1941:=%u))(&(objectClass=group)(member:1.2.840.113556.1.4.1941:=%pg)))"
ntp config
diag sys ntp status
config system ntp
set ntpsyn enable
set server-mode enable
set interface <interface_list>
end
sd-wan config
config system virtual-wan-link
    config members
        edit 1
            set interface <primary interface>
        next
        edit 2
            set interface <secondary interface>
            set priority 10
        next
    end
end
HA CONFIG
session pickup
config system ha
set session-pickup enable
end
session pickup udp & icmp
config system ha
set session-pickup enable
set session-pickup-connectionless enable
end
session pickup multicast
config system ha
set multicast-ttl <5 - 600 sec>
end
diagnose commands
diagnose sys ha status → check HA status
diagnose sys ha checksum → must be the same on all peers
to manage a HA system
execute ha manage <cluster_id> <admin_username>
→ execute ha manage 1 <username>
failover
execute ha failover set <cluster_id>
execute ha failover set 1
status
get system ha status
→ to stop the failover status
execute ha failover unset 1
to check serial numbers
get sys central-management
HA Failure checks
# verify TCP port 5199 connectivity
diagnose sniffer packet <port> ‘port 5199’ <level>
debug on HA daemon
diagnose debug application ha 255
diagnose debug enable
check if there is pending synced data
diagnose ha status
force resync
diagnose ha force-resync
to enable web-proxy
config firewall policy
    edit <firewall policy number>
        set inspection-mode proxy
        set http-policy-redirect enable
    next
end
Authentication
Authentication Schemes
- negotiate = negotiate the method with the web client (kerberos, ntlm, basic and so on)
config authentication scheme
  edit <scheme-name>
      set method [ basic | digest | ntlm | form | negotiate | fsso | rsso | ssh-publickey]
      set user-database [ local | <ldap-server> | <radius-server> | <fsso-name> | <rsso-name> | <tacacs+-server>]
      set require-tfa [ enable | disable ]
      set fsso-guest [ enable | disable ]
end
Authentication Rule
config authentication rule
    edit <rule-name>
        set protocol [ http | ftp | socks | ssh]
        set status [ enable | disable ]
        set srcaddr <addr-name or addrgrp-name>
        set ip-based [ enable | disable ]
        set sso-auth-method <scheme-name>
        set active-auth-method <scheme-name>
    next
end
Authentication Settings
config authentication setting
    set sso-auth-scheme <scheme-name>
    set active-auth-scheme <scheme-name>
end
FORTIMANAGER
reset all configuration except interface and routing configuration
execUte reset all-settings
execute reset all-except-ip


execute format { disk | disk-ext3 | disk-ext4} <RAID-level> deep-erase <erase-count>

# reset all settings will:
#   → reset fortimanager to factory default settings
#   → erase the configuration on flash, including IP address and routes
#   → disconnect all the sessions and reboot fortimanager
# format command will:
#   → deleta all databases and logs and partitions hard disk
ADOM
- each ADOM has its own system templates
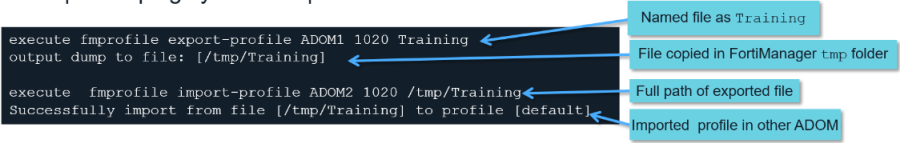
to export a profile:
→ execute fmprofile export-profile <ADOM name> <profile name> <output file name>
to import a profile:
→ execute fmprofile import-profile <ADOM name> <profile name> <full path of exported profile>
example:
FGFM Tunnel
to see the cluster members
diagnose dvm device list
check the FGFM tunnels for all managed devices
diagnose fgfm session-list
FGFM diagnose
diagnose debug application fgfmsd 255
diagnose debug enable
Hardware
diagnose system fsck harddisk
to enable scripting
config system admin setting
set show_tcl_script enable
end
DEBUG
# first always run diagnose debug reset

# Enable debug output on SSH/Telnet session
diagnose debug enable

# enable timestamp in the debug output
diagnose debug timestamp enable

# debug device-level operations: registering, deleting, refresh, auto-updates, resync process
diagnose debug application dmapi 255
diagnose dvm debug enable all

# debug ADOM to device database copy process and import policy packages
diagnose debug application securityconsole 255

# debug the registration process and install process, including CLI scripts run directly on devices, retrieves, and revision history
diagnose debug application depmanager 255
diagnose debug dpm conf-trace enable

# check if communication to public network is enabled
get fmupdate publicnetwork

# check update service
config fmupdate service
get

# show update version, last update, contract
get system fortiguard-service status

# check realtime update
diagnose debug application update -1
diagnose debug enable
execute update-now
troubleshooting fortiguard connectivity
diagnose fmupdate view-serverlist <fds|fct|fgd|fgc|fmtr>

## DATABASE INTEGRITY
```sh
# verify and correct parts of the device manager databases)
diagnose dvm check-integrity
# object config database intergrity - perform a check to see if upgrade and repair is nevessary
diagnose cdb check adom-integrity
# update device info by directly change DB
diagnose cdb check adom-revision
# internally upgrades existing ADOMs to the same ADOM version in order to clan up and correct the ADOM syntax
diagnose cdb check policy-packages
# verifies and checks dynamic mappings, and removes invalid dynamic mappings
diagnose cdb check update-devinfo
PREVIOUSbgp route tagging